Evaluating Growth-at-Risk as a tool for monitoring macro-financial risks in the Peruvian economy
In the wake of the Global Financial Crisis (GFC) there has been an increasing interest in understanding the relation between financial conditions and real activity. For this reason, there has recently been a renewed effort to develop new methods for assessing the risk of large output losses, given current financial conditions, rather than focusing exclusively on the prediction of expected growth rate of output. In a recent contribution, Adrian et al.(2019) have proposed Growth-at-Risk (GaR) as a framework for linking financial conditions and the distribution of the future evolution of GDP.
GaR methodology requires estimating a set of predictive quantile regressions (QR) where future economic activity is linked to current financial conditions, measured through a set of alternative market or bank related indicators. The quantile regression setup allows us to model the relation between financial markets and real economy in a flexible way, allowing for the possibility of a stronger correlation arising in bad times.
Application of the GaR to the Peruvian economy
Our work estimates a GaR model for the Peruvian economy using a broad set of macrofinancial variables on a monthly basis from August 2005 to August 2020, which are grouped within 5 sectors of the Peruvian financial system as showed in Table 1.
Table 1: Macrofinancial factors and target* variables
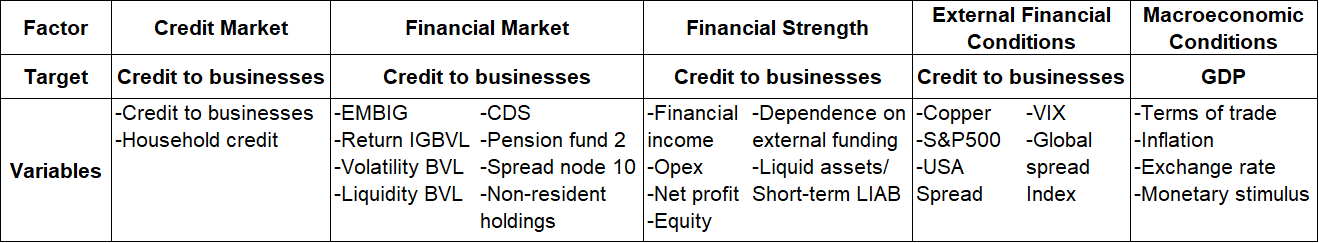 *The target variables allow us to employ the Orthogonal Projection for Latent Structures (O-PLS) in order to reduce the dimensionality of the information.
The GaR methodology requires the implementation of four steps: (1) a reduction of data-dimensionality using Orthogonal Projection for Latent Structures (O-PLS) where a broad set of macrofinancial variables are summarized in a reduced set of factors; (2) quantile regressions to obtain the quantiles of the distribution of future GDP growth given the current values of the macrofinancial factors; (3) the application of density fitting techniques to obtain a complete density function (pdf) for future GDP growth; and (4) a model evaluation exercise to select the best pdf among a broad set of density functions (which includes nonparametric, parametric and mixture of normal densities).
Even though the GaR methodology has increasingly been used by central banks in developed and emerging economies in recent years, new studies have pointed out the weak out-of-sample performance of this model for assessing the risk of future economic growth. To overcome this difficulty, our research focused on the implementation of model evaluation techniques (Log Score, probability integral transform and entropy) in order to obtain more reliable results. Using these selection criteria will allow us to select the distribution that best represent the Peruvian data.
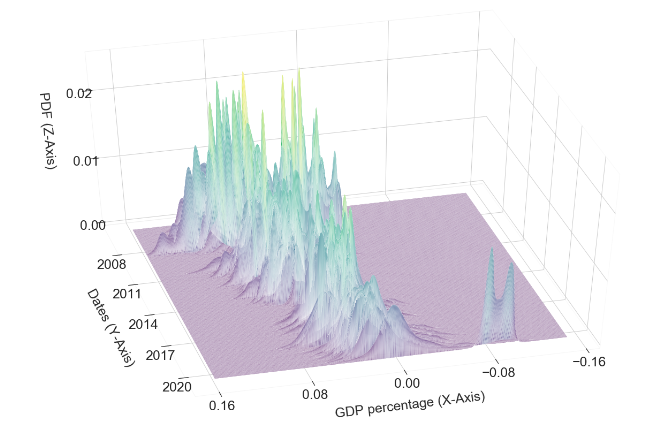
Having a reliable estimation of density forecast from QR results allow us to track density forecast of GDP growth across time, and also identify the building up of vulnerabilities to economic growth in the Peruvian economy. Figure 1 presents the evolution of the forecast density through time (z-axis), with the growth rate on the x-axis and months on the y-axis. The great financial crisis and the Covid-19 crisis are highlighted as the most stressful events for the Peruvian economy in recent years, with a distribution shifted to the left. The pandemic is the event that has most affected economic activity due to the strict confinement measures and the prolonged and almost generalized closure of economic activities. Additionally, GaR’s future growth density projections indicate that a recovery is expected in 2021 as most companies reopen their doors in support of the economic recovery.
Figure 1: Historical evolution of density forecast of GDP Growth
Policy analysis
Once we obtain a reliable GaR estimation, we proceed to implement a counterfactual exercise to evaluate the impact to a credit stimulus policy set in Peru as a response to the Covid-19 crisis called Reactiva Peru.
”Reactiva Peru” is a Guarantee Program designed by the Central Bank and the Ministry of Finance that allows Central Bank to provide low-cost liquidity to banks to supply loans to businesses while those loans are guarantee by the Treasury. By providing a large supply of low-cost credit to firms, especially SME, during the lockdown, this program reduced the impact of the Covid-19 shock to the Peruvian economy.
To evaluate this government policy, we implement a counterfactual scenario using the GaR Model to show the likely path of GDP growth if “Reactiva Peru” had not been implemented. To building this counterfactual scenario, we use credit information for firms that were not eligible to the Guarantee Program to construct the counterfactual path for the credit to business. We then use the VAR-X model used in the Stress Test analysis of the Central Bank of Peru to obtain the path of credit to households consistent with the counterfactual path of credit to business. Using these two results allows us to estimate the counterfactual path of the credit market factor.
To contemplate the full impact of this government policy, we also need to construct the counterfactual path of the other factors included in the GaR model. We translate the shock of the Credit Market factor to the rest of the factors following Killian (2006), and use a SVAR model in order to simulate counterfactual scenario for all the factors. Finally, we use these counterfactual paths for all the factors in the model and estimate the GaR model which give us the alternative distribution of future GDP growth.
Our results show that using the GaR model for the counterfactual scenario (without “Reactive Peru”) points to a significantly worse impact on the activity of the economy, not only in terms of lower expected growth (median 2020 GDP growth is -15% in the counterfactual scenario instead of -4.8% in the baseline scenario, as shown in Figure 2) but also in terms of higher risk (the 5% percentile is -17.4% in the counterfactual scenario instead of -6.6% in the baseline scenario).
The significant decrease of the GDP growth estimates if “Reactiva Perú” had not been applied suggests that this program has prevented a significant deterioration in economic activity that could have undermined the stability of the financial system by maintaining the chain of payments through the supply of low-cost credit to companies, especially small and medium-sized ones, which enabled them to sustain themselves during the health emergency period caused by the pandemic of Covid-19.
Figure 2: Density forecast for 2020 GDP growth: Counterfactual Analysis*
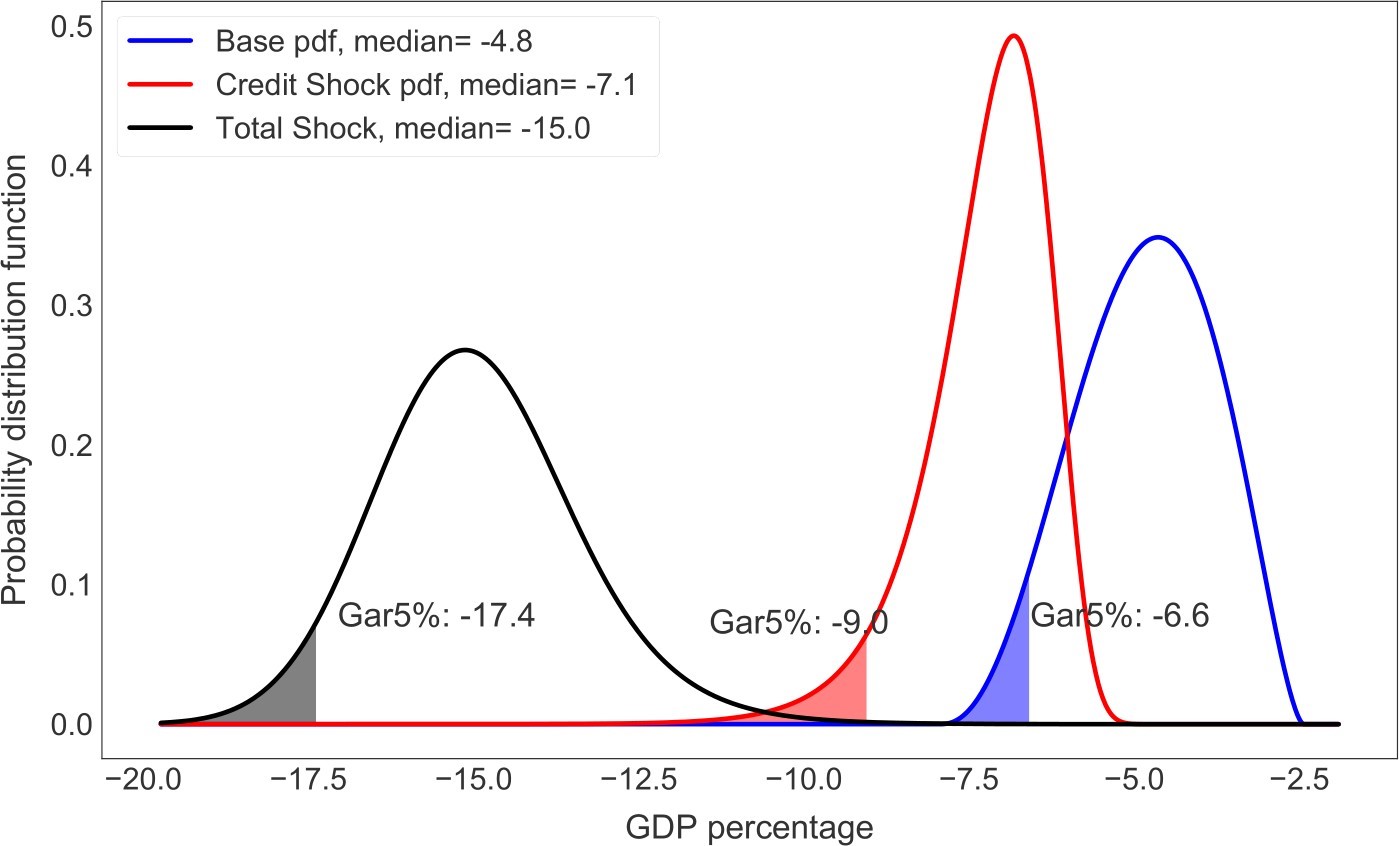
* Credit shock: counterfactual density using the alternative path of the credit market factor. Total shock: counterfactual density using the alternative paths of all the factors in the model.
Conclusions
Growth-at-risk is an important tool for monitoring macrofinancial risk since it allows for measuring the link between macrofinancial conditions and future GDP growth distribution. However, for the accuracy of the GaR results it is crucial to implement model evaluation techniques to avoid misleading interpretation. Moreover, flexibility of the GaR methodology allows us to perform a counterfactual scenario analysis that can help to identify sources of risks and communicate policy actions.
References
Tobias Adrian, Nina Boyarchenko, and Domenico Giannone. Vulnerable growth. American Economic Review, 109(4):1263–89, April 2019. doi: 10.1257/aer.20161923.
Francis X. Diebold, Todd A. Gunther, and Anthony S. Tay. Evaluating density forecasts with applications to financial risk management. International Economic Review, 39(4): 863–883, 1998. ISSN 00206598, 14682354.
Roger Koenker. Quantile Regression. Econometric Society Monographs. Cambridge University Press, 2005. doi: 10.1017/CBO9780511754098.
Ananthakrishnan Prasad, Selim Elekdag, Phakawa Jeasakul, Romain Lafarguette, Adrian Alter, Alan Xiaochen Feng, and Changchun Wang. Growth at Risk: Concept and. Application in IMF Country Surveillance. IMF Working Papers 2019/036, International Monetary Fund, February 2019. URL https://ideas.repec.org/p/imf/imfwpa/ 2019-036.html.
Lucrezia Reichlin, Giovanni Ricco, and Thomas Hasenzagl. Financial variables as predictors of real growth vulnerability. Technical report, 2020.
Barbara Rossi and Tatevik Sekhposyan. Alternative tests for correct specification of conditional predictive densities. Journal of Econometrics, 208(2):638–657, 2019. ISSN 0304-4076. doi: https://doi.org/10.1016/j.jeconom.2018.07.008. URL https://www. sciencedirect.com/science/article/pii/S0304407618302197.
James H. Stock and Mark W.Watson. Forecasting output and inflation: The role of asset prices. Journal of Economic Literature, 41(3):788–829, September 2003. doi:1257/002205103322436197. URL https://www.aeaweb.org/articles?id=10.1257/ 002205103322436197.
Johan Trygg and Svante Wold. Orthogonal projections to latent structures (o-pls). Journal of Chemometrics, 16(3):119–128, 2002. doi: https://doi.org/10.1002/cem. 695. URL https://analyticalsciencejournals.onlinelibrary.wiley.com/doi/ abs/10.1002/cem.695.